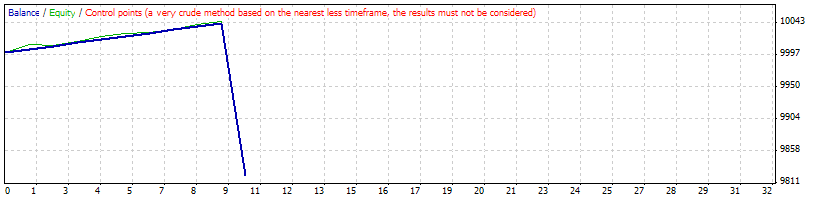
Strategy Tester Report
AlpariUK-Demo (Build 225)
| Symbol | USDCAD (US Dollar vs Canadian Dollar) | ||||
| Period | 1 Hour (H1) 2009.12.01 00:00 - 2009.12.31 18:00 (2009.12.01 - 2010.01.01) | ||||
| Model | Control points (a very crude method, the results must not be considered) | ||||
| Parameters | TakeProfit=50; Lots=0.1; TrailingStop=30; MACDOpenLevel=3; MACDCloseLevel=2; MATrendPeriod=26; | ||||
| Bars in test | 1515 | Ticks modelled | 13777 | Modelling quality | n/a |
| Mismatched charts errors | 2 | ||||
| Initial deposit | 10000.00 | ||||
| Total net profit | -177.47 | Gross profit | 42.05 | Gross loss | -219.51 |
| Profit factor | 0.19 | Expected payoff | -17.75 | ||
| Absolute drawdown | 278.31 | Maximal drawdown | 322.14 (3.21%) | Relative drawdown | 3.21% (322.14) |
| Total trades | 10 | Short positions (won %) | 3 (100.00%) | Long positions (won %) | 7 (85.71%) |
| Profit trades (% of total) | 9 (90.00%) | Loss trades (% of total) | 1 (10.00%) | ||
| Largest | profit trade | 4.78 | loss trade | -219.51 | |
| Average | profit trade | 4.67 | loss trade | -219.51 | |
| Maximum | consecutive wins (profit in money) | 9 (42.05) | consecutive losses (loss in money) | 1 (-219.51) | |
| Maximal | consecutive profit (count of wins) | 42.05 (9) | consecutive loss (count of losses) | -219.51 (1) | |
| Average | consecutive wins | 9 | consecutive losses | 1 | |
| # | Time | Type | Order | Size | Price | S / L | T / P | Profit | Balance |
| 1 | 2009.12.03 07:45 | sell | 1 | 0.10 | 1.04819 | 0.00000 | 1.04769 | ||
| 2 | 2009.12.03 08:26 | t/p | 1 | 0.10 | 1.04769 | 0.00000 | 1.04769 | 4.78 | 10004.78 |
| 3 | 2009.12.07 04:02 | sell | 2 | 0.10 | 1.05403 | 0.00000 | 1.05353 | ||
| 4 | 2009.12.07 16:35 | t/p | 2 | 0.10 | 1.05353 | 0.00000 | 1.05353 | 4.75 | 10009.53 |
| 5 | 2009.12.10 05:20 | buy | 3 | 0.10 | 1.05813 | 0.00000 | 1.05863 | ||
| 6 | 2009.12.11 17:15 | t/p | 3 | 0.10 | 1.05863 | 0.00000 | 1.05863 | 4.62 | 10014.15 |
| 7 | 2009.12.15 09:15 | buy | 4 | 0.10 | 1.06173 | 0.00000 | 1.06223 | ||
| 8 | 2009.12.15 09:50 | t/p | 4 | 0.10 | 1.06223 | 0.00000 | 1.06223 | 4.71 | 10018.86 |
| 9 | 2009.12.15 09:50 | buy | 5 | 0.10 | 1.06329 | 0.00000 | 1.06379 | ||
| 10 | 2009.12.15 12:15 | t/p | 5 | 0.10 | 1.06379 | 0.00000 | 1.06379 | 4.70 | 10023.56 |
| 11 | 2009.12.16 09:16 | sell | 6 | 0.10 | 1.06043 | 0.00000 | 1.05993 | ||
| 12 | 2009.12.16 10:15 | t/p | 6 | 0.10 | 1.05993 | 0.00000 | 1.05993 | 4.71 | 10028.27 |
| 13 | 2009.12.16 20:15 | buy | 7 | 0.10 | 1.06207 | 0.00000 | 1.06257 | ||
| 14 | 2009.12.16 20:20 | t/p | 7 | 0.10 | 1.06257 | 0.00000 | 1.06257 | 4.70 | 10032.97 |
| 15 | 2009.12.16 20:20 | buy | 8 | 0.10 | 1.06332 | 0.00000 | 1.06382 | ||
| 16 | 2009.12.16 20:50 | t/p | 8 | 0.10 | 1.06382 | 0.00000 | 1.06382 | 4.70 | 10037.67 |
| 17 | 2009.12.16 20:52 | buy | 9 | 0.10 | 1.06421 | 0.00000 | 1.06471 | ||
| 18 | 2009.12.17 03:02 | t/p | 9 | 0.10 | 1.06471 | 0.00000 | 1.06471 | 4.38 | 10042.05 |
| 19 | 2009.12.18 17:15 | buy | 10 | 0.10 | 1.06963 | 0.00000 | 1.07013 | ||
| 20 | 2009.12.30 11:10 | close | 10 | 0.10 | 1.04676 | 0.00000 | 1.07013 | -219.51 | 9822.53 |